BEAMA is de spreekbuis van de Asset Management sector in België.
Welkom op onze website!
Je kunt ons verder ook volgen op onze Linkedin-pagina.

NIEUWS & EVENEMENTEN

Internationale Vrouwendag
Ter gelegenheid van Internationale Vrouwendag op 8 maart, hebben we enkele vragen voorgelegd aan Myriam Vanneste en Caroline Tubeuf, de…

Persbericht – Cijfers ICB-sector 3de trimester 2023
BEAMA publiceerde op 23 februari haar persbericht omtrent de cijfers van de ICB-sector van het 3de trimester 2023.
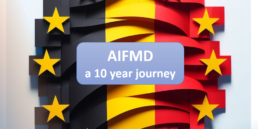
BEAMA seminarie – AIFMD
Op donderdag 18 april 2024 van 12u tot 17u, organiseert BEAMA een seminarie over de 10de verjaardag van de AIFMD-wetgeving in België.

Visiedocument 2024 – 2026
BEAMA vzw heeft een visiedocument opgesteld dat de koers van de asset management sector in België voor de komende 3 jaren zal bepalen.
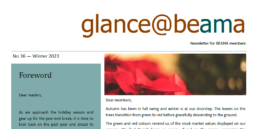
BEAMA nieuwsbrief – Glance@beama #36
BEAMA publiceerde op 18 december 2023 haar 36ste nieuwsbrief, genaamd "Glance@beama", over het reilen en zeilen van de asset management sector.…

ICB INFORMATIE
ICB INFORMATIE
Op deze pagina kun je terecht voor publicaties van netto-inventariswaarden van ICB’s en hun compartimenten, evenals ICB-mededelingen.
ONZE LEDEN
BEAMA heeft meer dan 100 leden en vertegenwoordigt daarmee een groot deel van de Belgische Asset Management sector


NAVIGEER DOOR ONZE WEBSITE…
… en leer ons en de Asset Management sector beter kennen
BEAMA publiceert elk kwartaal statistieken over de evolutie van de Belgische ICB-sector.
In een handig overzicht vind je ook de voornaamste kerncijfers over de sector bij ons.

In de facts & figures van de jaarverslagen vind je een overzicht van de evolutie over 10 jaar, van de plaats van de ICB’s in de financiële spaargelden van de Belgische gezinnen en van de Belgische ICB-markt in een internationale context, alsook enkele kerncijfers.
Daarnaast publiceert BEAMA regelmatig relevante nieuwsbrieven en deelt zij nuttige templates met de sector.
Wil je meer weten over het type lidmaatschap, en wat dit precies betekent? Wil je weten hoe je lid kunt worden?
Lees dan hier onze Brochure over het lidmaatschap. Ben je overtuigd? Download dan ons aanvraagformulier en bezorg het ons. Wij zorgen voor de rest!